Inspiration
A repository of data-driven visual stories from around the world, humanising complex issues with design and technology.
Dataviz
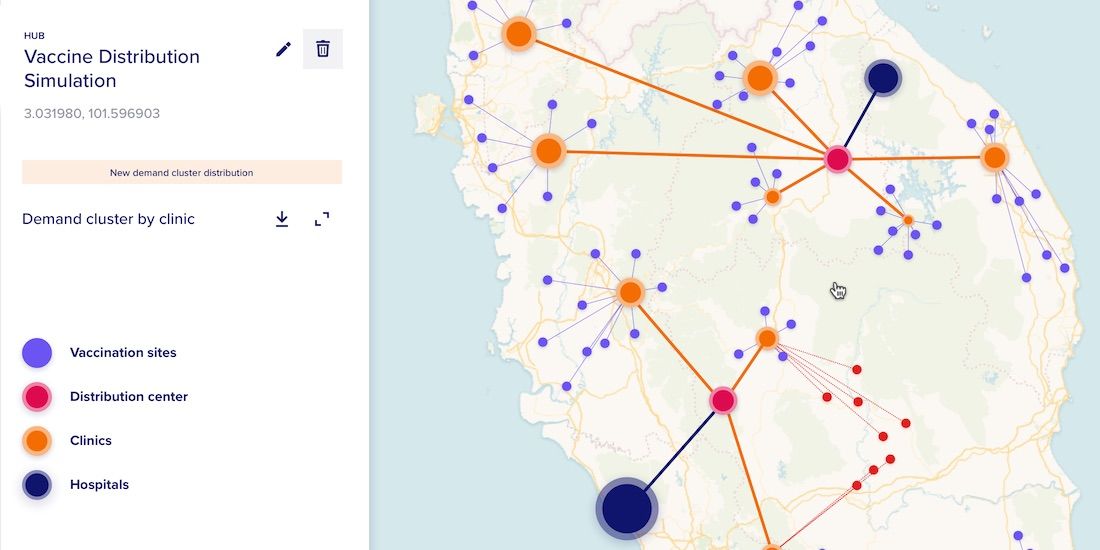
COVID-19 Vaccine: Optimizing Cold Chain Transportation
With COVID-19 vaccines requiring strict storage, ensuring an efficient cold chain transportation network using spatial will be key for effective distribution.

Multimedia
Decoding the Antiwar Messages of Miniature Protesters in Russia
Fish, asterisks, blank messages and the crossed out Z letter: All of these are symbols of opposition to the invasion of Ukraine by Russia.

Multimedia
Memory and Migration
The lands and rights of Indigenous peoples in Guatemala have long been trampled by a tiny elite, foreign corporations, and the US government. Until the cycle of invasion and exploi...

Illustration
Inside the Proton, the ‘Most Complicated Thing’ Imaginable
The positively charged particle at the heart of the atom is an object of unspeakable complexity, one that changes its appearance depending on how it is probed. We’ve attempted to c...

Illustration
An illustrated explanation of Russia’s deportation of Ukrainians, from the war zone to a remote camp
There was no way out but into the country that destroyed their homes.

Dataviz
America’s Highest Earners And Their Taxes Revealed
Secret IRS files reveal the top US income-earners and how their tax rates vary more than their incomes. Tech titans, hedge fund managers and heirs dominate the list, while the like...

Multimedia
Accel - 40 Years in Tech
Technology has transformed our world and paved the way for a bright future. Join us as we reflect on key moments of innovation since 1983.

Documentary
The story of the Portuguese Guinean African Commandos | DIVERGENTE
“Por ti, Portugal, eu juro!” é uma reportagem da DIVERGENTE que conta a história dos Comandos Africanos da Guiné, tropa de elite do Exército criada durante a Guerra Colonial.

3D
An Inside Look at Covid’s Lasting Damage to the Lungs
This 3-D reconstruction of lung scans reveals damage that has lingered for years in patients who became severely ill early in the pandemic.
Inspiration of the Week

Dataviz
Dashboard - IISS Myanmar Conflict Map
World-leading authority on global security, political risk and military conflict.

Multimedia
America's Lost Chinatowns
Stories of Chinatown in the US usually focus only on New York or San Francisco. But for Asian Americans in the country's heartland, these small enclaves are the lifeblood of a comm...

Illustration
A visual guide to America’s US$31 trillion national debt
The United States has the world’s largest national debt at US$31.4 trillion and its debt-to-GDP ratio also ranks among the highest in the world. Here is a visual guide to help unde...

Multimedia
Telegram: Chronology of a Radicalization
The CeMAS report "Chronology of a radicalization: How Telegram became the most important platform for conspiracy ideologies and right-wing extremism" reveals how Telegram became th...

Interactive
Dataviz
City in Flux: Informal and formal mobility networks revealed
City in Flux explores Cape Town's diversity based on the mobility lines. Together, they form a network of over 800 lines throughout Cape Town. Each of them is defined by the social...
Multimedia
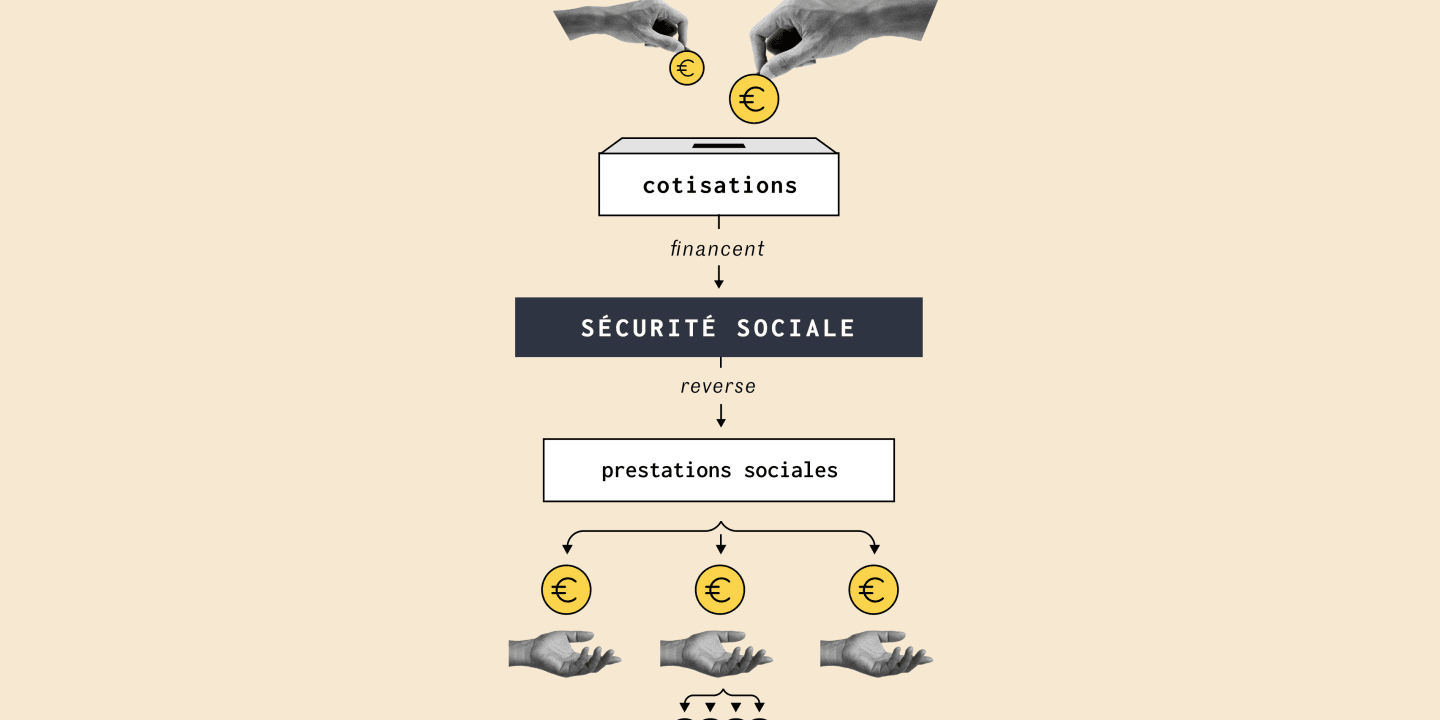
Fraude sociale : pourquoi il est compliqué de mesurer son montant
Le ministre délégué aux comptes publics, Gabriel Attal, a présenté des mesures pour lutter contre le travail dissimulé, la fraude aux prestations et aux allocations.

Interactive
Dataviz
Find out what data is available about you online — but be warned, it might feel a little creepy
Have you ever wondered how much of your personal information is available online? Here's your chance to find out.

Illustration
How a deadly bat virus found new ways to infect people
First it jumped from bats to pigs. Then pigs gave it to people. Now the brain-damaging Nipah virus has leapt from bats to humans without an intermediary.

Interactive
How The Legend of Zelda Changed the Game
For nearly four decades, the video game franchise has emphasized exploration and the joy of discovery. Millions of fans hope that the newest entry, Tears of the Kingdom, will push ...

Illustration
Interactive
A visual guide to Eurovision
Songs, winners and history of Europe’s annual song contest.

Dataviz
The Index of State Dynamism
The concept of dynamism captures the intrinsic vitality of an economy: how quickly it adapts, how efficiently it redeploys its resources to more productive uses, and how successful...

3D
Quantum computing could break the internet. This is how.
We don’t know when. We don’t know who will get there first. But Q-day will happen — and it will change the world as we know it.

Dataviz
From Queen Elizabeth to Kate Middleton: How the royal women make a statement with their color choice...
We analyzed thousands of photos to show how the women of the British monarchy use their clothing to send a message.
Dataviz
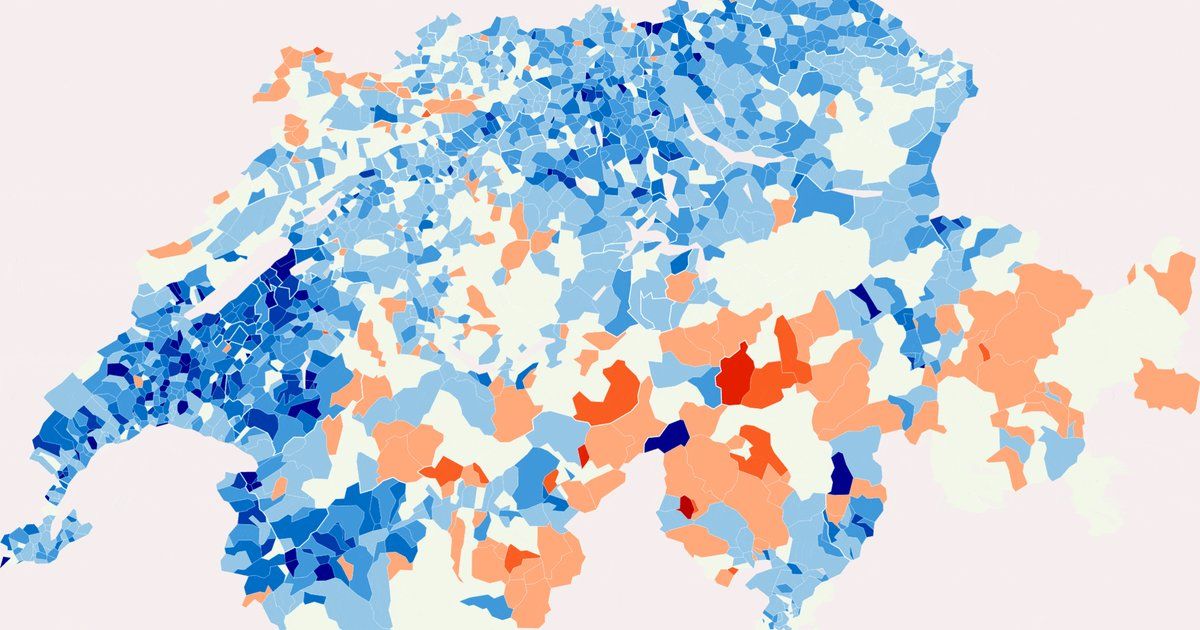
Population, immigration, vieillissement: découvrez l'évolution de la Suisse en 15 graphiques
Le pays, mû par une démographie galopante, passera le cap des 9 millions d’habitants en 2023.

Interactive
BBC News - Crossing Divides
Can you cross the ideological divide of Brexit? Play to find out!