Inspiration
A repository of data-driven visual stories from around the world, humanising complex issues with design and technology.
Inspiration of the Week

Cinematic
Illustration
Fishing the feed
Farmed seafood has a dirty secret. It is fed using billions of wild-caught fish trawled from the oceans. Find out what goes on under the surface.

Dataviz
Illustration
Cantonese Opera: history, performance, theatre and costume design
Cantonese opera is still one of Hong Kong's favourite art forms.

Cinematic
Documentary
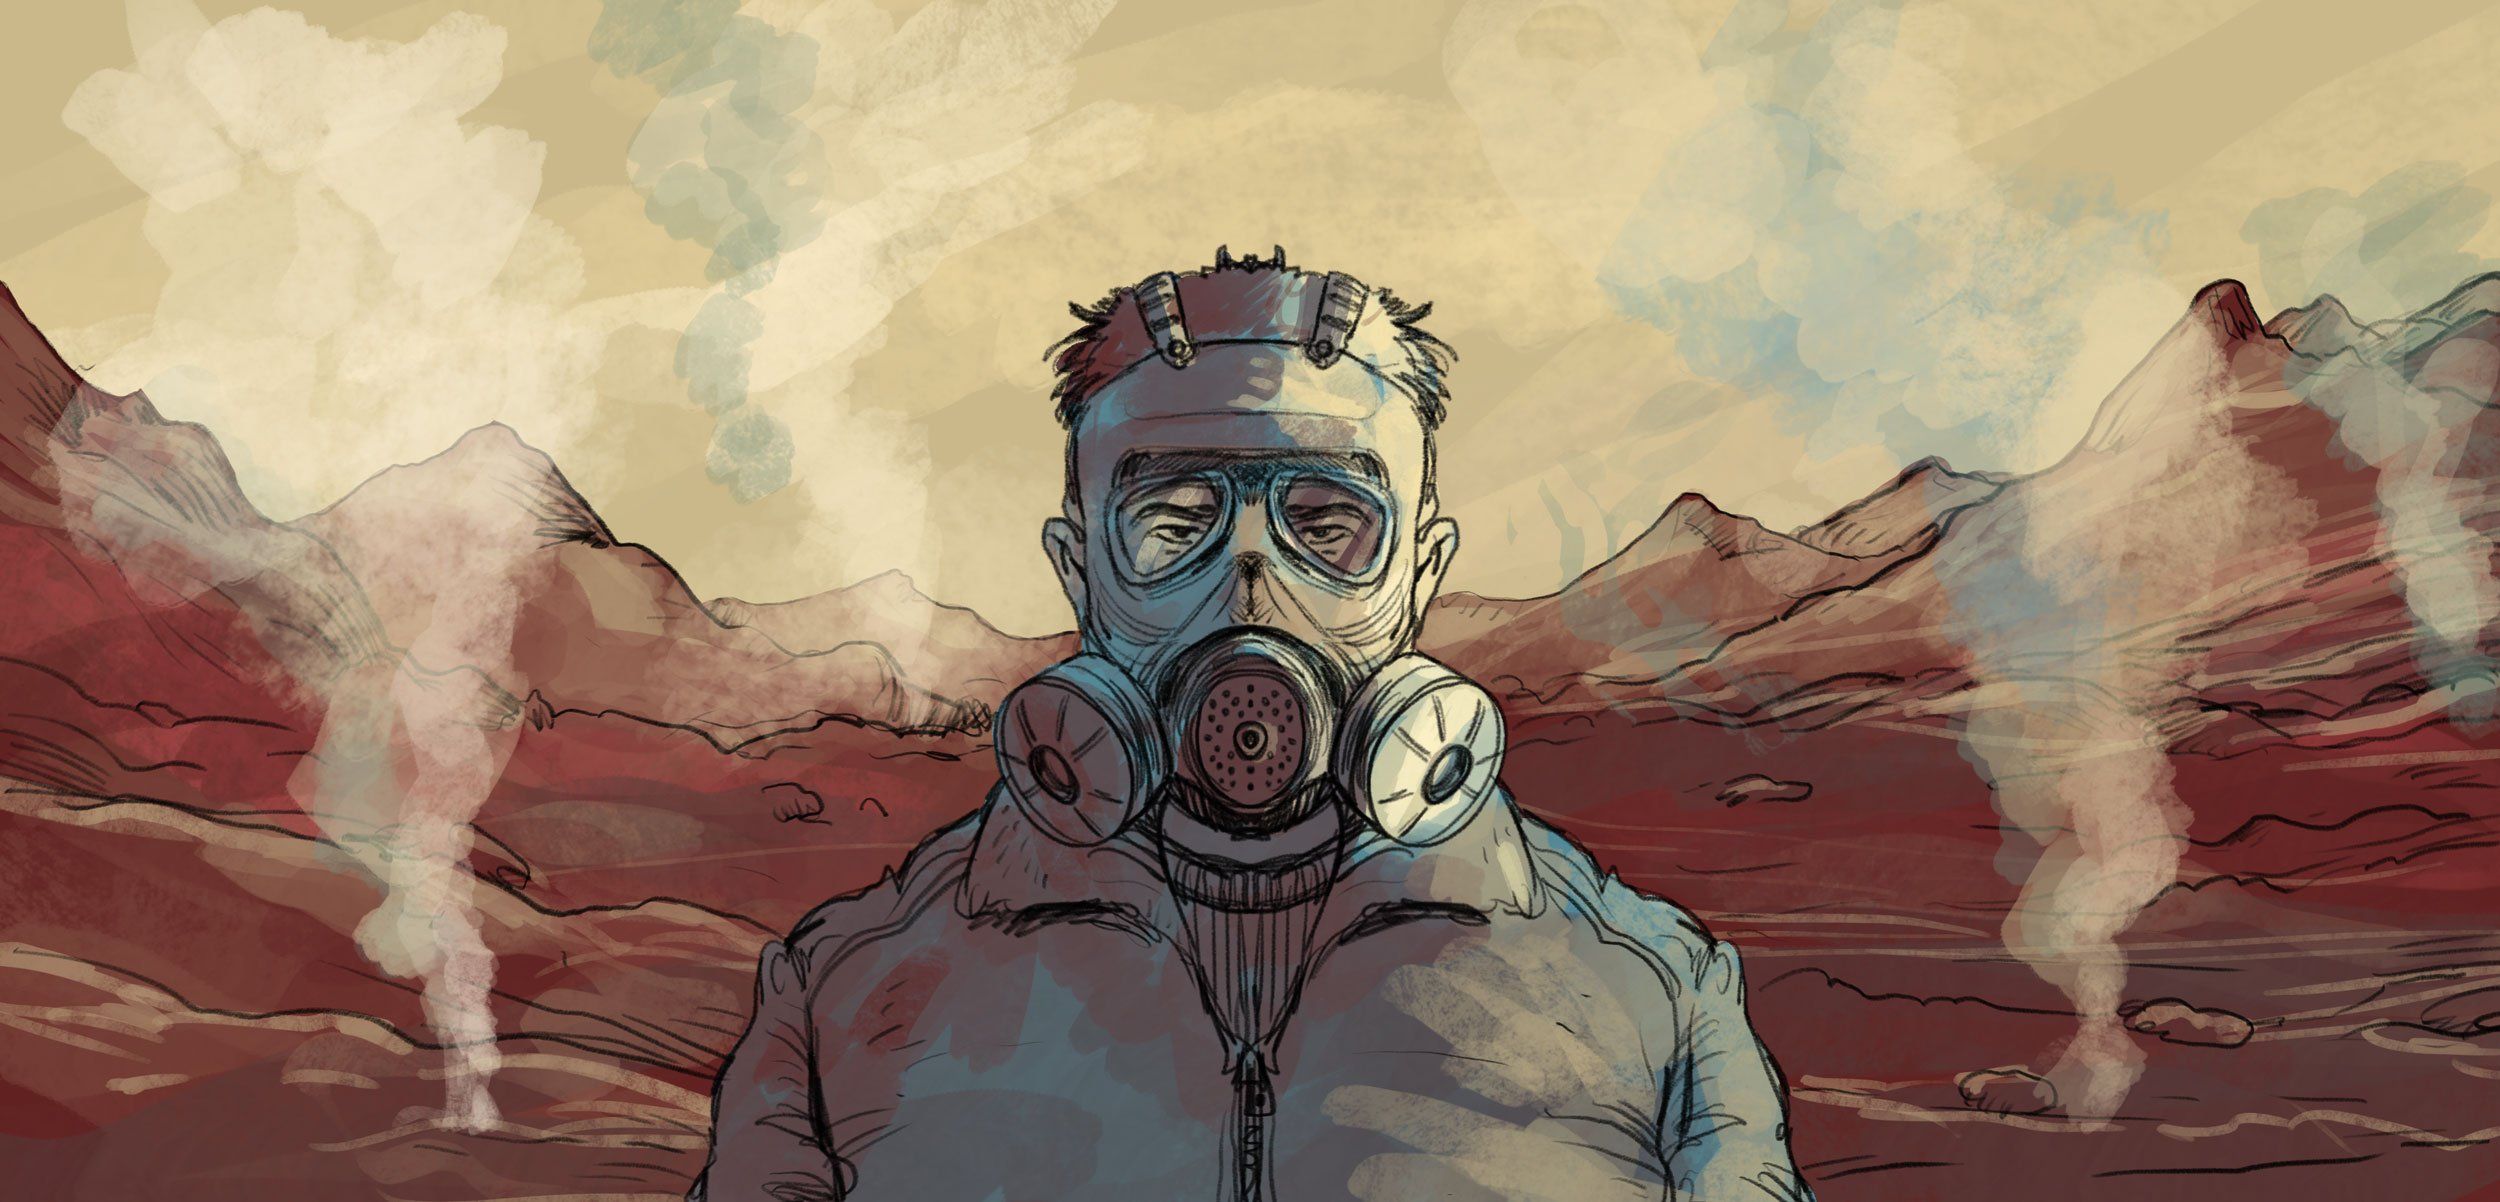
Extreme Heat Will Change Us
Half the world could soon face dangerous heat. We measured the daily toll it is already taking.
Inspiration of the Month

3D
Cinematic
How space debris threatens modern life
A failure to regulate low Earth orbit could have disastrous consequences.

Interactive
Analyzing the Gender Representation of 34,476 Comic Book Characters
Female characters appear in superhero comics less often than males — but when they are included, how are they depicted?

Audio
Illustration
The Bear and his Scarf | Club Bruges
A story by Club Bruges about club love and respect.

3D
Dataviz
How arming Ukraine is stretching the US defence industry
Detailed supply chain mapping of two weapons that changed the war reveals a complex web of companies under significant strain as the industry returns to a wartime footing.

Maps
Interactive
The map of the observable universe
This map shows a slice of our Universe. It was created from astronomical data taken night after night over a period of 15 years using a telescope in New Mexico, USA.

Interactive
Glory To Ukraine
Our country has been attacked by Russian Federation, it is destroying our lives, it wants to trample on freedom. Ukraine is our home, we will defend it to the end, our voices will ...

3D
Interactive
Sea Shepherd No Fishing
Fishing nets are killing our ocean. And if the ocean dies, we die. Take action now on www.no-fishing.net and help free the ocean from fishing nets #NoFishingNet.

Illustration
How drones are helping scientists locate endangered plants
New technologies can now reach places too risky for humans and search for the last surviving specimens before it’s too late.

Illustration
Rubber, Race and Colonial Exploitation
An interactive and highly illustrated story that investigates the historic rubber industry in Malaya, and its discriminative practices.

Dataviz
How the Champions League final descended into chaos – visual investigation
The most definitive account yet at what went wrong, why it went wrong, and how Liverpool supporters were instantly blamed on the night.
Inspiration of the Week

Illustration
Why your smartphone is causing you ‘text neck’ syndrome
Most of us hunch over our smartphone for at least two hours a day. This can effectively increase the weight of your head by up to 27kg, damage your posture, and if you text while w...

Illustration
What is permafrost and why might it be the climate change time bomb?
Forget about carbon emissions and carbon neutrality – if permafrost continues to melt at current rates, it could be game over for humanity.

Interactive
Documentary
NFB - Welcome to Pine Point
Imagine your hometown never changed. That no one ever grew old or moved on. Part book, part film, part family photo album, Welcome to Pine Point unearths a place frozen in time and...

3D
Dataviz
Das Pharma-Universum | The Pharma-Universe
Wenn die Pharmabranche ein Universum wäre, sähe es so aus.

3D
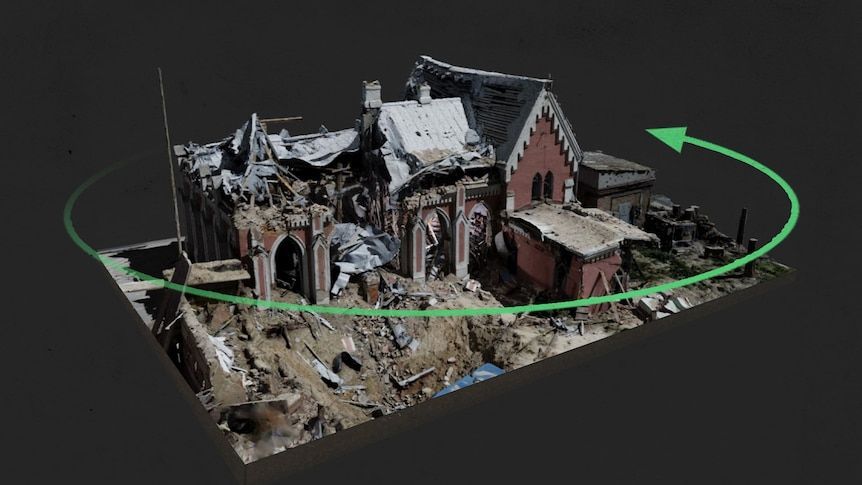
These 3D models take you inside the ruins of Ukraine's cultural treasures
Using laser scanners and drones, a team of volunteers travelled across Ukraine documenting the destruction of cultural sites. This is the data they collected.
Inspiration of the Week

Dataviz
The Trailblazers, The Risk Takers, The Ceiling Breakers, The Firsts
This season marks the 50th anniversary Title IX, so Google Trends took a look at how search interest in the WNBA has grown and who has paved the way.

Interactive
Documentary
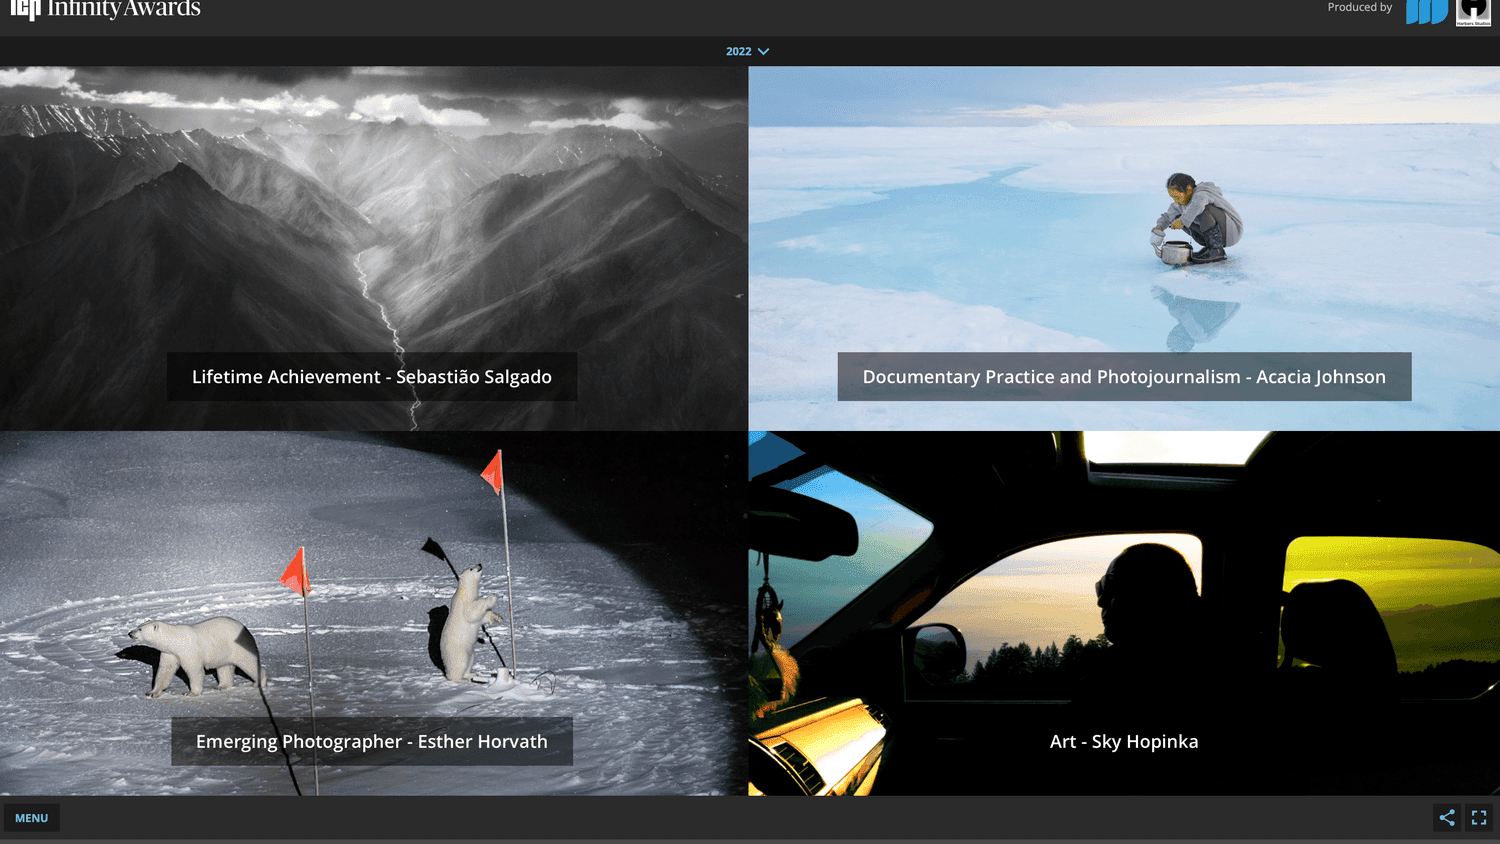
ICP Infinity Awards
Since 1985, the International Center of Photography has recognized outstanding achievements in photography with its prestigious Infinity Awards.

Dataviz
Illustration
What’s the state of Southeast Asian sci-fi?
Western science fiction often depicts our collective culture in restrictive, erroneous ways. How about we let Asian sci-fi speak for itself?

Illustration
Dataviz
The China Ship
First chapter of “The China Ship” the story of the first globalization that connected Europe, the Americas and China through trade.

Dataviz
Hidden Fentanyl Is Driving a Fatal New Phase in US Opioid Epidemic
Florida’s Volusia County is racing to treat addiction while battling a wave of overdoses caused by tainted street drugs.

Interactive
What literature do we study from the 1990s?
The turn-of-the-century literary canon, using data from college syllabi.